WS6 OXYGEN SENSORS ON VEHICLE
what an oxygen sensor is?

http://i01.i.aliimg.com/img/pb/837/867/265/1283765874043_hz-myalibaba-web5_8478.JPG
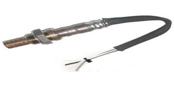
An oxygen sensor is an electro mechanical device that is fitted in the exhaust stream to sense the amount of oxygen content in the exhaust gases left over after combustion. The oxygen sensor measures the amount of free oxygen in the exhaust gases and compares the difference to the amount of oxygen that is in the atmosphere. By this, a voltage is generated within the sensor which is sent as a voltage signal to the ECU which is then judged to be rich or lean.
Practical
In practical we had to find a vehicle fitted with an oxygen sensor to test with an oscilloscope.
The vehicle I made test on is a FORD KA. The oxygen sensor is located under the hood in the engine bay up front by the radiator, which is easy to get to. The sensor is a 4 wire Zirconium Narrow range type. The colour of the wires and what they stand are below:
White = heater +
White = heater –
Black = signal +
Grey = sensor ground
To test the sensor I had to back probe the signal positive wire connection using a pin.

Above is a photo I took of the oxygen sensor in closed loop mode cycling from rich to lean. The engine at this stage is running at 2500 rpm. The voltage goes as high as 0.9 volts and low as 0.2 volts. The average voltage is about 0.45 volts.
This sensor is functioning good as it has a “cross count” of about one per second. This means it is sending its signal back to the ECU at the correct speed to keep the ECU up to date with the air fuel ratio in order to make adjustments to the air/fuel. If the signal was not signalling properly then the amount of cross counts will be reduced. This will indicate that the sensor is becoming sluggish. If the sensor is sluggish you could remove it and clean it with a solvent spray suitable for it. Then replace it and see if it made any changes.

In the picture above it shows an oxygen sensor like the one I am testing. As the exhaust gases pass by the sensor a voltage is generated based on the amount of “free” oxygen in the exhaust compared to the oxygen in the atmosphere. The sensor tip can become contaminated with engine oil, engine coolant and/or wrong additives in the fuel. This causes faulty voltage signals back to ECU. For example if the tip is contaminated and blocked then the sensors going to get false impression that the air fuel ratio is leaner than it actually is. The ECU will then try to make the air fuel ratio richer to try and maintain a perfect ratio of 14.7:1.
Consequences of this will damage the catalytic converter. A rich operating condition causes the converter to run hotter than normal. If the converter gets hot enough, the catalyst substrate inside may actually melt forming a partial or complete blockage. The result can be a huge drop in highway performance or stalling because of a buildup of backpressure in the exhaust stream. It is also very expensive to replace.

Below I have copied and pasted parts out the WS6 practical workbook and added to my blog to help show my work.
5.0 Make this Oxygen Sensor go rich by accelerating once or twice. (The fuel system should normally make the system go rich when you do a sudden acceleration.) Push on the accelerator quickly but don’t let the rpm go high enough to hurt the engine. (If you act like you will hurt the engine you will be asked to leave lab.) The signal should go over 0.85V.
5.1 Freeze your pattern as it goes rich and draw or photograph it onto the graph below: Note the voltage and time per division or scale next to the graph.

In the frame above the voltage goes as high as 0.85 volts. The response time is good as you can see how accelerating the throttle causing a rich mixture has affected the waveform.
6.0 Make this Oxygen Sensor go lean by doing a sudden deceleration. Gently run the rpm up to about 3,000, and let the RPM drop suddenly. The fuel system should make the system go lean on deceleration. The signal should go below 0.2V.
6.1 Freeze your pattern as it goes rich and draw or photograph it onto the graph below: Note the voltage and time per division or scale next to the graph.

The voltage goes low as 0.131 volts. This is a good a voltage reading as the signal should go below 0.2 volts. A lean mixture is caused when there is a lot of oxygen left over in the exhaust gases. A lean mixture tends to produce NOX pollutants and a rich mixture produces HC pollutants. If a vehicle was running lean it doesn’t mean that the oxygen sensor is the main problem. Parts like a faulty EGR valve can cause the air fuel ratio to be lean.
WS5 SCAN TOOL DIAGNOSTICS

The vehicle I worked on is a 1987Toyota
 Above is a picture of an 0BD 1 connection under the steering coloumn of a nissan pulsar 1996.
Here is a list of information the vehicle is showing on the screen:

I then checked to see if the system holds any fault codes. It has no codes detected.
The tutor then created a fault without me looking so that I could go through the scan tool and try to diagnose the fault my self.
The fault codes that are now in the system are code numbers 7 and 22. Systems affected are throttle position sensor (7) and water temperature circuit (22).
Before doing anything to fix these faults I had a look at the PID’S (Parameter identification of system voltages) to see how the faults affected the readings that I got at the beginning. The readings that don’t make sense are:
I then located the fault to be a disconnected tps and ect sensor. While I was accelerating the throttle the tps voltage didn’t change. At closed throttle it remained zero and at WOT it remained zero.
To repair the fault I re connected the plugs to their sensors. I then played around with the throttle to see if the voltage would change, and it did. At idle the voltage was 0.8 volts and as I started to open the throttle up more the voltage started increasing.
I then cleared the codes using the scan tool function, and then checked if the codes were still in the system. The codes are now cleared.
Using live data when fault finding, allows you to look at all the values of the sensors on one screen which makes it easier and faster for diagnosing faults. This is because I can compare readings of one component to the other. I don’t have to go around with my multi meter trying to look for sensors that are hard to reach and impossible to get to.
WS5 SCAN TOOL DIAGNOSTICS

The vehicle I worked on is a 1987

Here is a list of information the vehicle is showing on the screen:

Type of information (PID = Parameter Identification) | Letters to describe it E.g. TPS | Value of data | Units for data E.g. volts |
| Engine Load (how much air comes in) | Intake | 29 | kpa |
| Engine RPM | RPM | 800 | RPM |
| Throttle angle | TPS | 0.8 | v |
| Engine coolant temperature | ECT | 85 | degree |
| Intake air temperature | N/A | N/A | N/A |
| Fuel Injection opening pulse | FIOP | 2 | ms |
| Transmission select position | N/A | N/A | N/A |
| Vehicle Speed | N/A | 0 | km/h |
| Oxygen sensor(s) | N/A | LEAN RICH | N/A |
| Fuel Trim | N/A | N/A | N/A |
| Idle control | ISC | 39 | % |
| Power steering condition | N/A | N/A | N/A |
| Air conditioning condition | A/C Signal | off | switch on/off |
| Exhaust Gas Recirculation (EGR) | N/A | N/A | N/A |
| Fuel Evap or Purge condition | N/A | N/A | N/A |
| Malfunction Indicator Light (MIL) | N/A | N/A | N/A |
| Barometric Pressure | N/A | N/A | N/A |
I then checked to see if the system holds any fault codes. It has no codes detected.
The tutor then created a fault without me looking so that I could go through the scan tool and try to diagnose the fault my self.
The fault codes that are now in the system are code numbers 7 and 22. Systems affected are throttle position sensor (7) and water temperature circuit (22).
Before doing anything to fix these faults I had a look at the PID’S (Parameter identification of system voltages) to see how the faults affected the readings that I got at the beginning. The readings that don’t make sense are:
Type of information (PID = Parameter Identification) | Letters to describe it | Value of data | Units for data |
Throttle position sensor | tps | 0 | volts |
I then located the fault to be a disconnected tps and ect sensor. While I was accelerating the throttle the tps voltage didn’t change. At closed throttle it remained zero and at WOT it remained zero.
To repair the fault I re connected the plugs to their sensors. I then played around with the throttle to see if the voltage would change, and it did. At idle the voltage was 0.8 volts and as I started to open the throttle up more the voltage started increasing.
I then cleared the codes using the scan tool function, and then checked if the codes were still in the system. The codes are now cleared.
Using live data when fault finding, allows you to look at all the values of the sensors on one screen which makes it easier and faster for diagnosing faults. This is because I can compare readings of one component to the other. I don’t have to go around with my multi meter trying to look for sensors that are hard to reach and impossible to get to.
good work so far, hope you haven't copy and pasted? Try and put all your post for blog 2 in one big post and put all your posts for blog 3 in another post so I know which one is for blog 2 and blog 3
ReplyDelete